A UI/UX Case Study
No. 03 — B2B SAAS DASHBOARD
StudioOS Management System
Engineering an intuitive data control room for scaling design studio operations.
Role
Product & UX/UI Designer
Product Archetype
Multi-Tenant SaaS Workspace
Grid Architecture
12-Column Relational Grid
Chapter 01
Project Description
Workflow overhaul for global agency teams.
- Operational Friction: Studio directors lose up to 35% of weekly billable hours jumping between detached project tracking tools, financial sheets, and file shares.
- The Interface Intervention: StudioOS unifies these administrative components into a single visual canvas, automatically tracking multi-project health and active asset deliveries.
StudioOS · Control Room OverviewFig. 01
studioos.app · /overviewv.2.4.1
ARR
$1.42M
+24%
Active projects
47
+6
Render queue
12 / 16
75% util
Avg. margin
31.4%
+2.1pt
Pipeline · last 12 weeksUSD · weekly
Live alerts
RND-204 failed at 67%
Tower-09 milestone due
PO-184 over budget
Chapter 02
Best-in-Class Research
Deconstructing generic checklist platforms.
- The Competitor Gap: Generic platforms (Asana, Monday.com) handle basic checklists well but completely fail the dense, file-heavy requirements of architectural pipelines.
- Product Strategy: StudioOS merges enterprise financial tracking with highly visual rendering and blueprint pipelines, removing the need for manual workarounds.
Competitive MatrixFig. 02
Platform
Render Q
Phase IA
Margin
Files
Client
Density
Asana
4
2
1
3
3
2
Monday.com
4
3
2
3
3
3
Notion
3
3
2
4
3
3
Airtable
3
4
3
4
3
4
Smartsheet
3
3
4
3
2
3
BQE Core
2
4
5
3
3
2
Deltek
2
4
5
4
2
1
Monograph
3
5
5
4
4
3
StudioOS
5
5
5
5
5
5
Chapter 03
Heuristics Evaluation
Mitigating visual fatigue across dense grids.
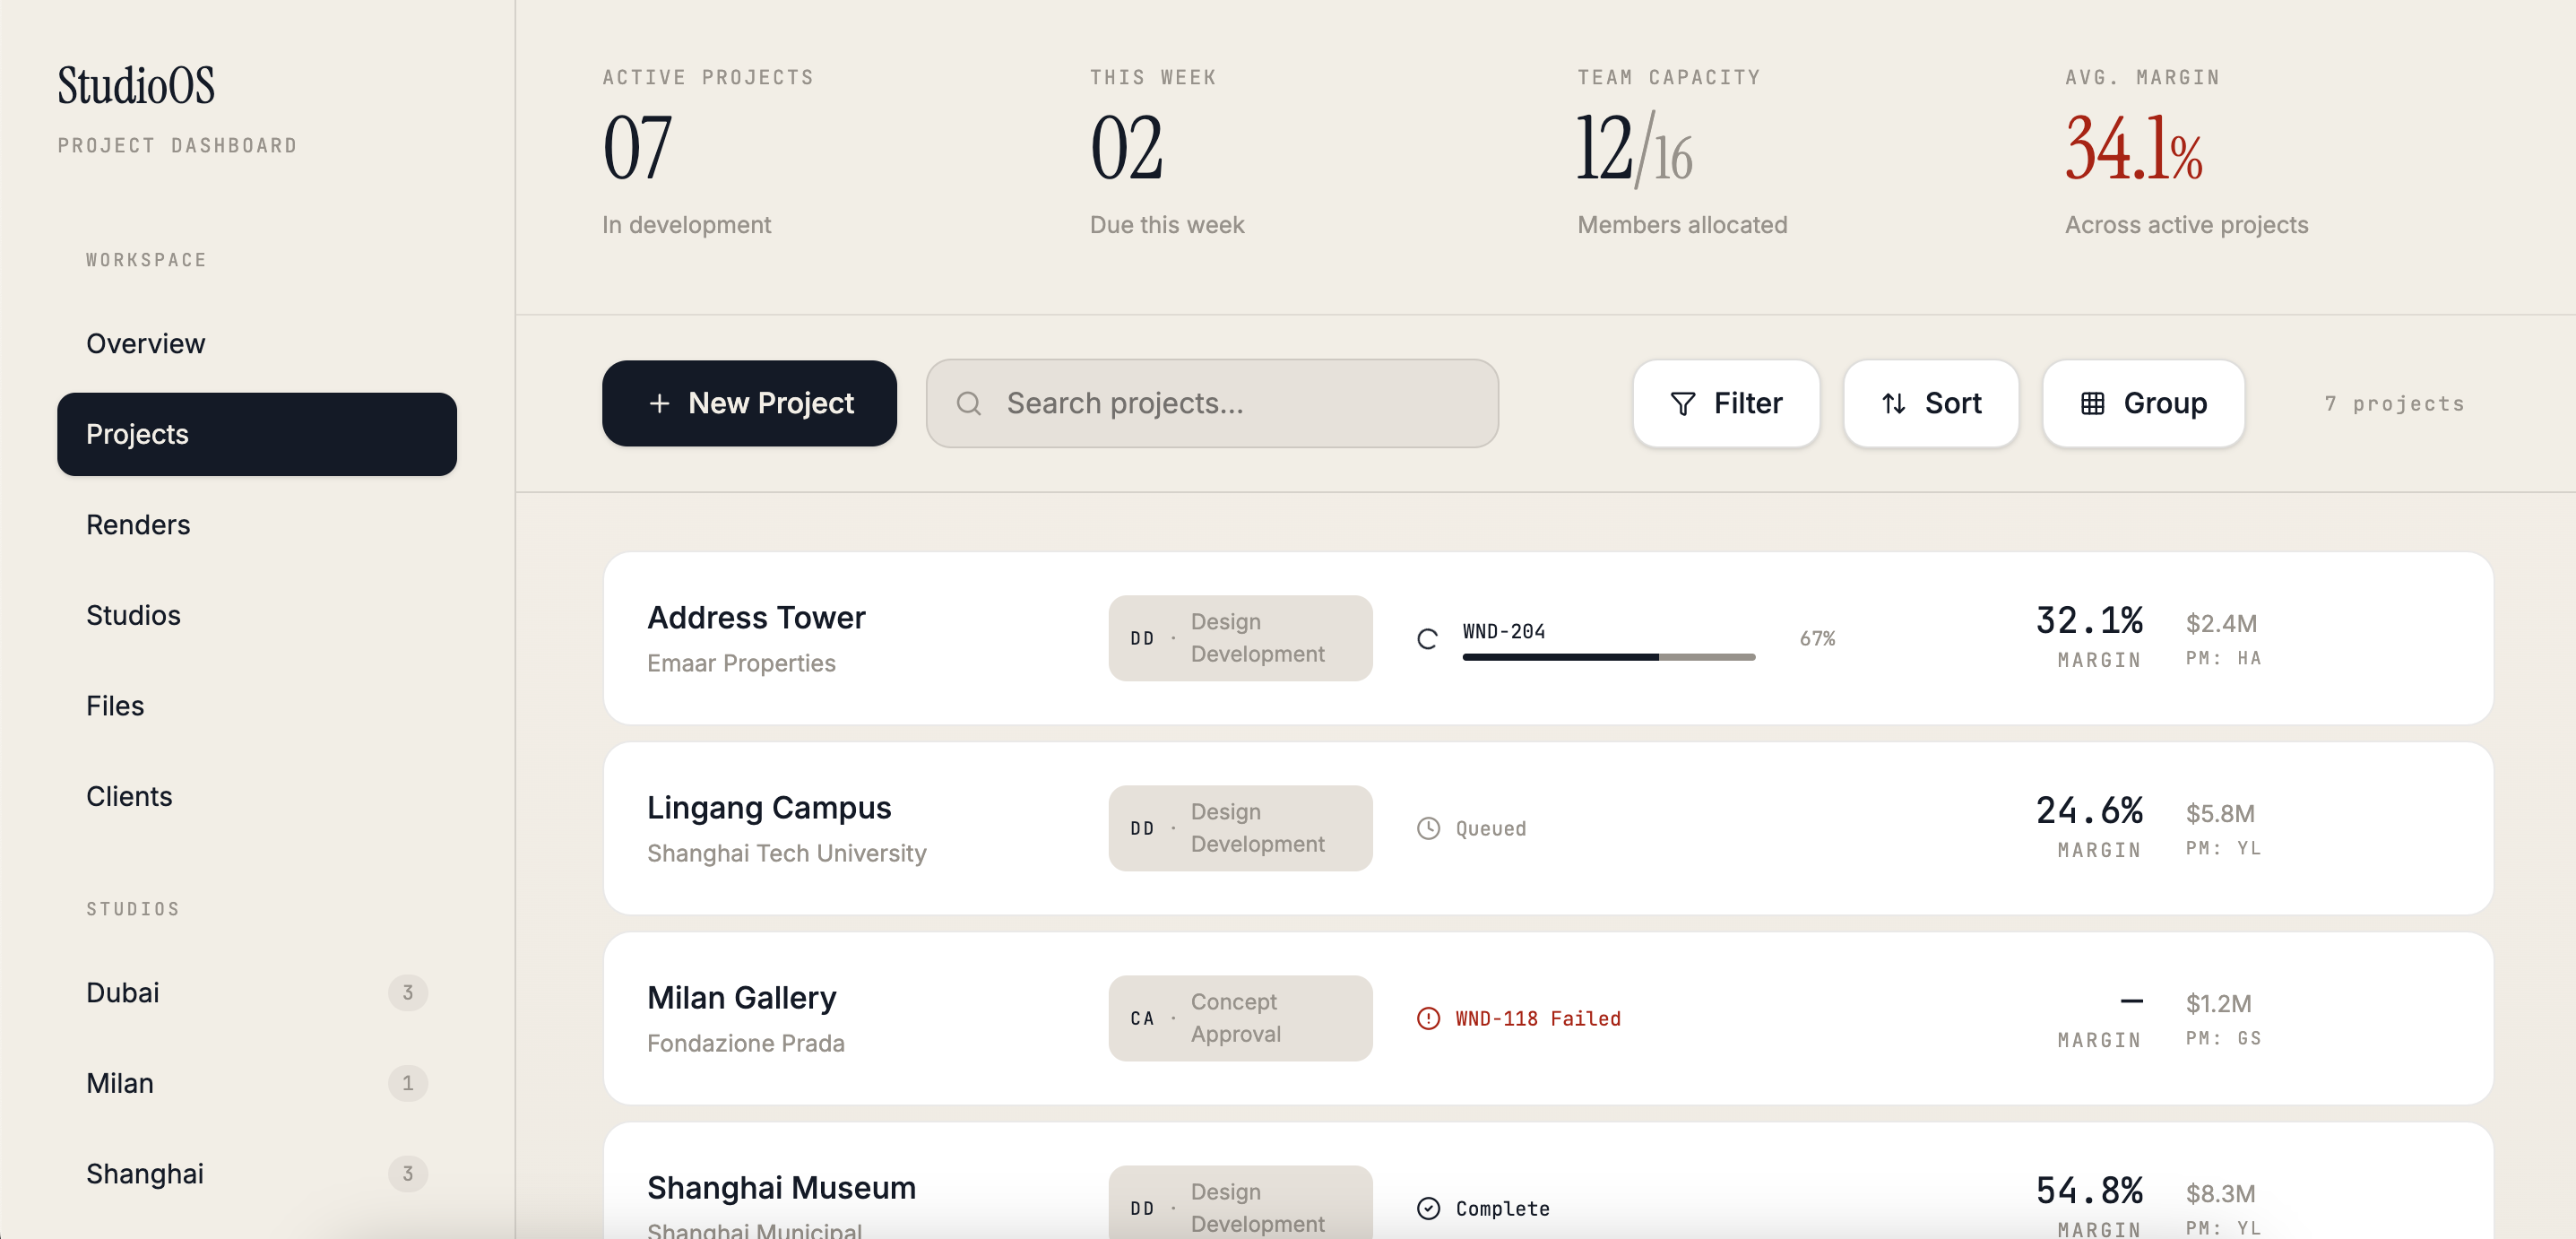
- Information Overload Audit: Legacy software packs dense text numbers onto a single screen, resulting in extreme visual noise and data entry mistakes.
- The UX Fix: Implemented a strict component hierarchy that isolates financial tracking, task statuses, and files into clean, predictable modular panels.
Content Audit · Live DashboardFig. 03
Chapter 04
Service Blueprint
Synchronizing frontend states with relational backend triggers.
- Relational Integrity: When a project manager adjusts a procurement cost or milestone stage, the platform automatically updates agency-wide revenue metrics.
- The Infrastructure Map: Aligned user clicks with background cloud calculation scripts and notification microservices to ensure a seamless real-time application.
System Choreography — Frontend ↔ Relational BackendFig. 04
UI EVENT
Click row
Inline edit ¢
Tab out
Toast: saving…
Toast: saved ✓
Row re-paint
CLIENT STATE
row.focus
row.dirty=t
validate()
optimistic
rollback?
settled
API
GET /row
PATCH /row
POST /audit
WS subscribe
WS broadcast
GET /rollup
DB TRIGGERS
—
row UPDATE
audit INSERT
phase RECALC
margin RECALC
portfolio AGG
t+0ms
t+40ms
t+90ms
t+140ms
t+260ms
t+380ms
Chapter 05
Stakeholders & Analytics
Structuring user permissions by professional role.
- Principal Directors View: High-level studio utilization charts, financial health margins, and master resource allocation meters.
- Project Managers View: Micro-level task boards, active 3D rendering engine tracking timers, and material procurement columns.
- External Client Portal: A simplified, white-labeled view stripped of agency finances, focusing entirely on blueprint approvals and milestone galleries.
Role Permissions × Audience MixFig. 05
CapabilityDIRPMCLIENT
View margins●◐—
Edit phase●●—
Approve invoice●——
Queue render●●—
Approve milestone●◐●
Download deck●●●
Active seats · last 30 days
Project Managers42%
Design Leads30%
External Clients20%
Principal Directors8%
Chapter 06
Ethnographic Field Study
Automating layout logic based on workplace habits.
- The Behavioral Discovery: Administrative friction peaks when design phases transition (e.g., from Concept to Construction Documents), causing document version loss.
- The Design Pivot: StudioOS introduces an automated layout transformer that dynamically updates interface fields as an underlying project matures.
Field Notebook — Studio C, week of phase transitionFig. 06
MON 09:22
PM exports timesheet to Excel to reconcile margin manually. Spreadsheet has 14 tabs, all hand-linked.
TUE 16:04
Render RND-118 dies at 84% overnight. Nobody alerted. Discovered next morning by junior designer.
THU 11:47
Client emails asking for "the latest deck" — third time this week. PM rebuilds PDF from scratch.
Workarounds in the wild
- — Excel margin sheet (14 tabs)
- — Slack channel "#render-watch"
- — Google Doc of client passwords
- — Manual Friday "phase ping" email
- — Personal Notion mirror of CRM
Chapter 07
Co-Design Workshop Alignment
Consolidating raw studio feedback into concrete grid layouts.
- The Feature Filter: Transformed user brainstorm sessions into strict layout requirements, eliminating text-heavy clutter for an arrangement of clean containers.
- Grid Strategy: Locked down an unyielding multi-pane grid system: a global sidebar menu, a primary metrics summary bar, and expandable data views.
Workshop Sticky WallFig. 07
HMW collapse the margin spreadsheet into the row itself?
HMW alert on render failure without paging anyone?
HMW expose phase state to the client without leakage?
HMW edit a relational grid as fast as Excel?
HMW reuse PM-built decks as auto-generated client packs?
HMW collapse 14 tabs into one canvas?
Chapter 08
Opportunity Documentation
Mapping core dashboard friction points to functional layout needs.
- The Core Dashboard: Combines project phases, render limits, and active design updates into a single scannable card area.
- The Relational Data Grid: Incorporates inline text editing and customizable multi-select filter parameters to optimize manual input data speed.
Opportunity RegisterFig. 08
| # | Opportunity | Surface | Impact | Effort |
|---|---|---|---|---|
| O-01 | Inline-edit relational data grid | Grid | H | M |
| O-02 | Live render queue with auto-retry | Queue | H | M |
| O-03 | Margin engine on row recompute | Finance | H | H |
| O-04 | Phase-aware field schema | Forms | H | L |
| O-05 | Single pinned metrics bar | Shell | H | L |
| O-06 | White-label client portal | Portal | H | M |
| O-07 | Audit trail per cell | Trust | M | L |
| O-08 | Procurement PO sync | Finance | M | M |
| O-09 | Multi-tenant SSO | Auth | M | M |
| O-10 | Realtime presence on rows | Collab | M | H |
Chapter 09
Vision Concept
Minimizing dashboard decoration to isolate essential business data.
- The Visual Canvas: A dark, high-contrast, structural environment designed to minimize eye fatigue over prolonged data entry and review sessions.
- The Spatial Focus: Screen elements follow an unyielding vertical layout rhythm, prioritizing clarity over visual noise to keep information instantly discoverable.
Vision Diagram — From 14 Tools to One CanvasFig. 09
Before
After
Chapter 10
Qualitative User Testing
Proving dashboard performance against hard interaction metrics.
- The Quantitative Surges: Usability testing cut task completion times for project phase updates from an average of four minutes down to 24 seconds.
- The Usability Win: Integrating an inline-editing system directly into the data rows completely removed the need for slow, traditional multi-step forms.
Usability MetricsFig. 10
Phase update
4:00 → 0:24
Before
After
Margin reconcile
12:18 → 1:02
Before
After
Client deck send
Manual → 1-click
Before
After
Chapter 11
User Flows
Eradicating operational dead-ends via single-interaction loops.
- Three-Click Engineering: Modeled daily administrative sequences to guarantee users can complete updates directly from the central workspace page.
- Automated Prompts: Marking a design phase complete immediately triggers an intelligent modal loading the required parameters for the next stage.
Flow Diagram — Phase Update in Three ClicksFig. 11
Chapter 12
Wireframes
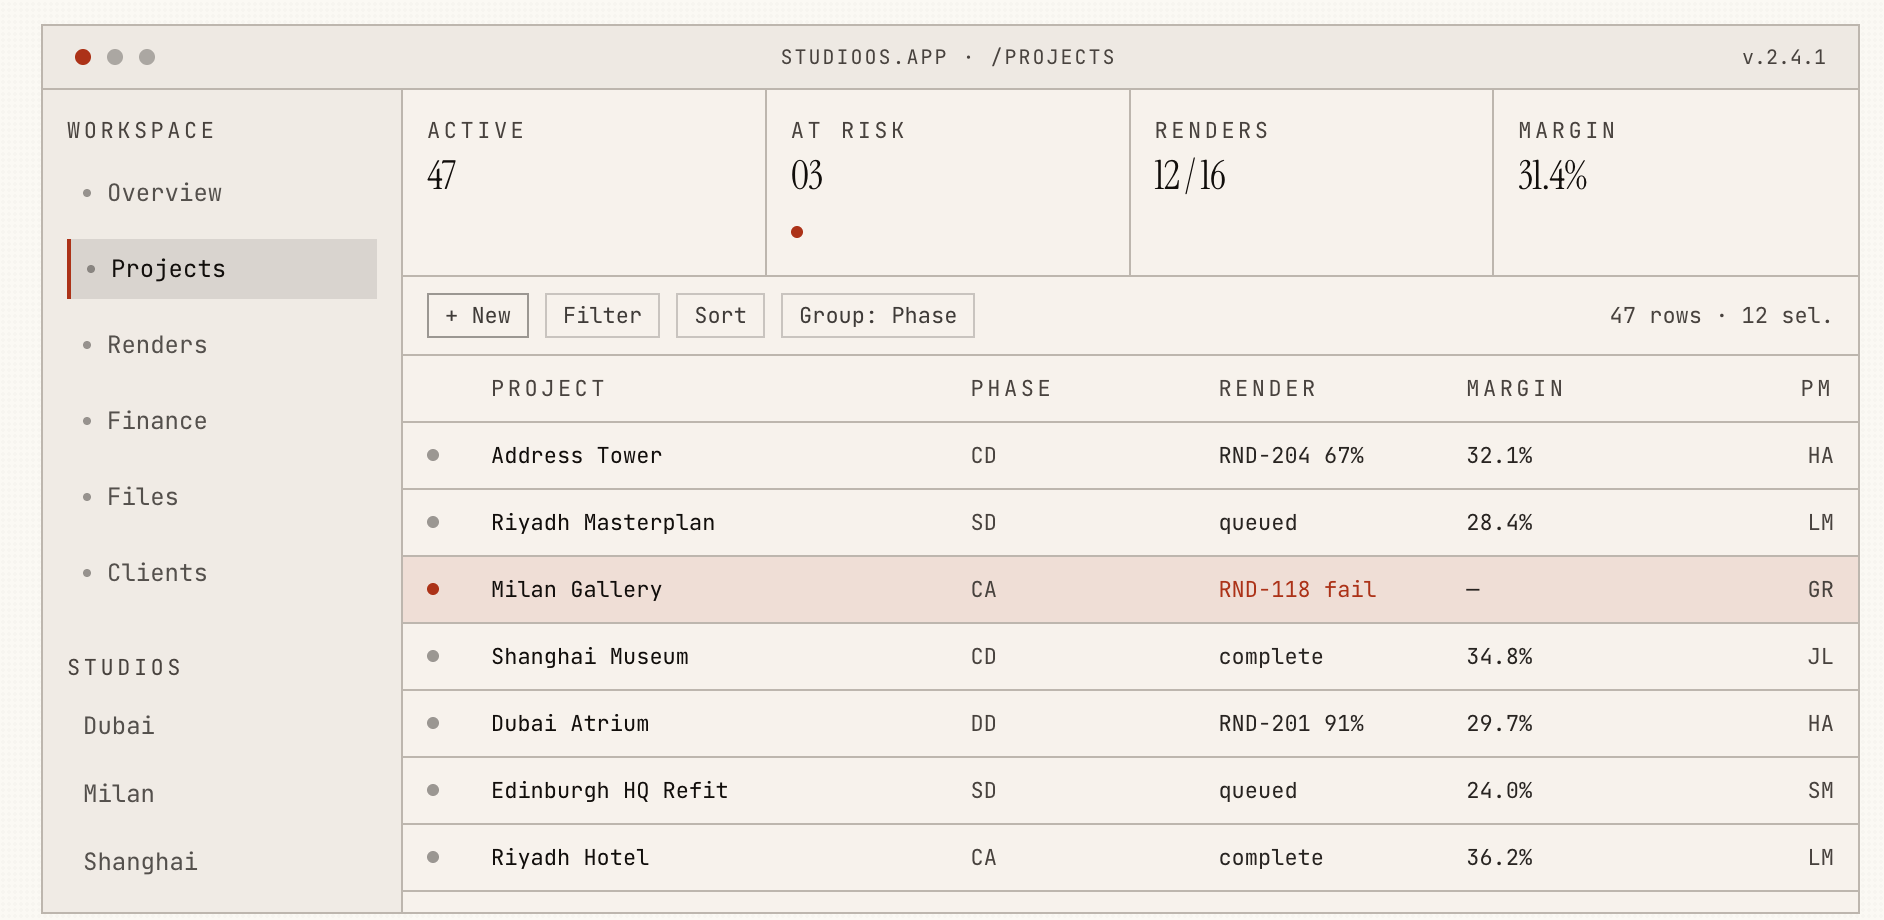
Ensuring cross-device data legibility across rigid grid systems.
- The Structural Grid: A layout grid built around tight component spacing to maximize data visibility for office desktop users.
- Mobile Adaptive Logic: Folds horizontal table data rows into clean, stackable user interface cards to maintain field legibility for on-site managers.
Structural Wireframe · Projects WorkspaceFig. 12
Chapter 13
Hi-Fi Designs
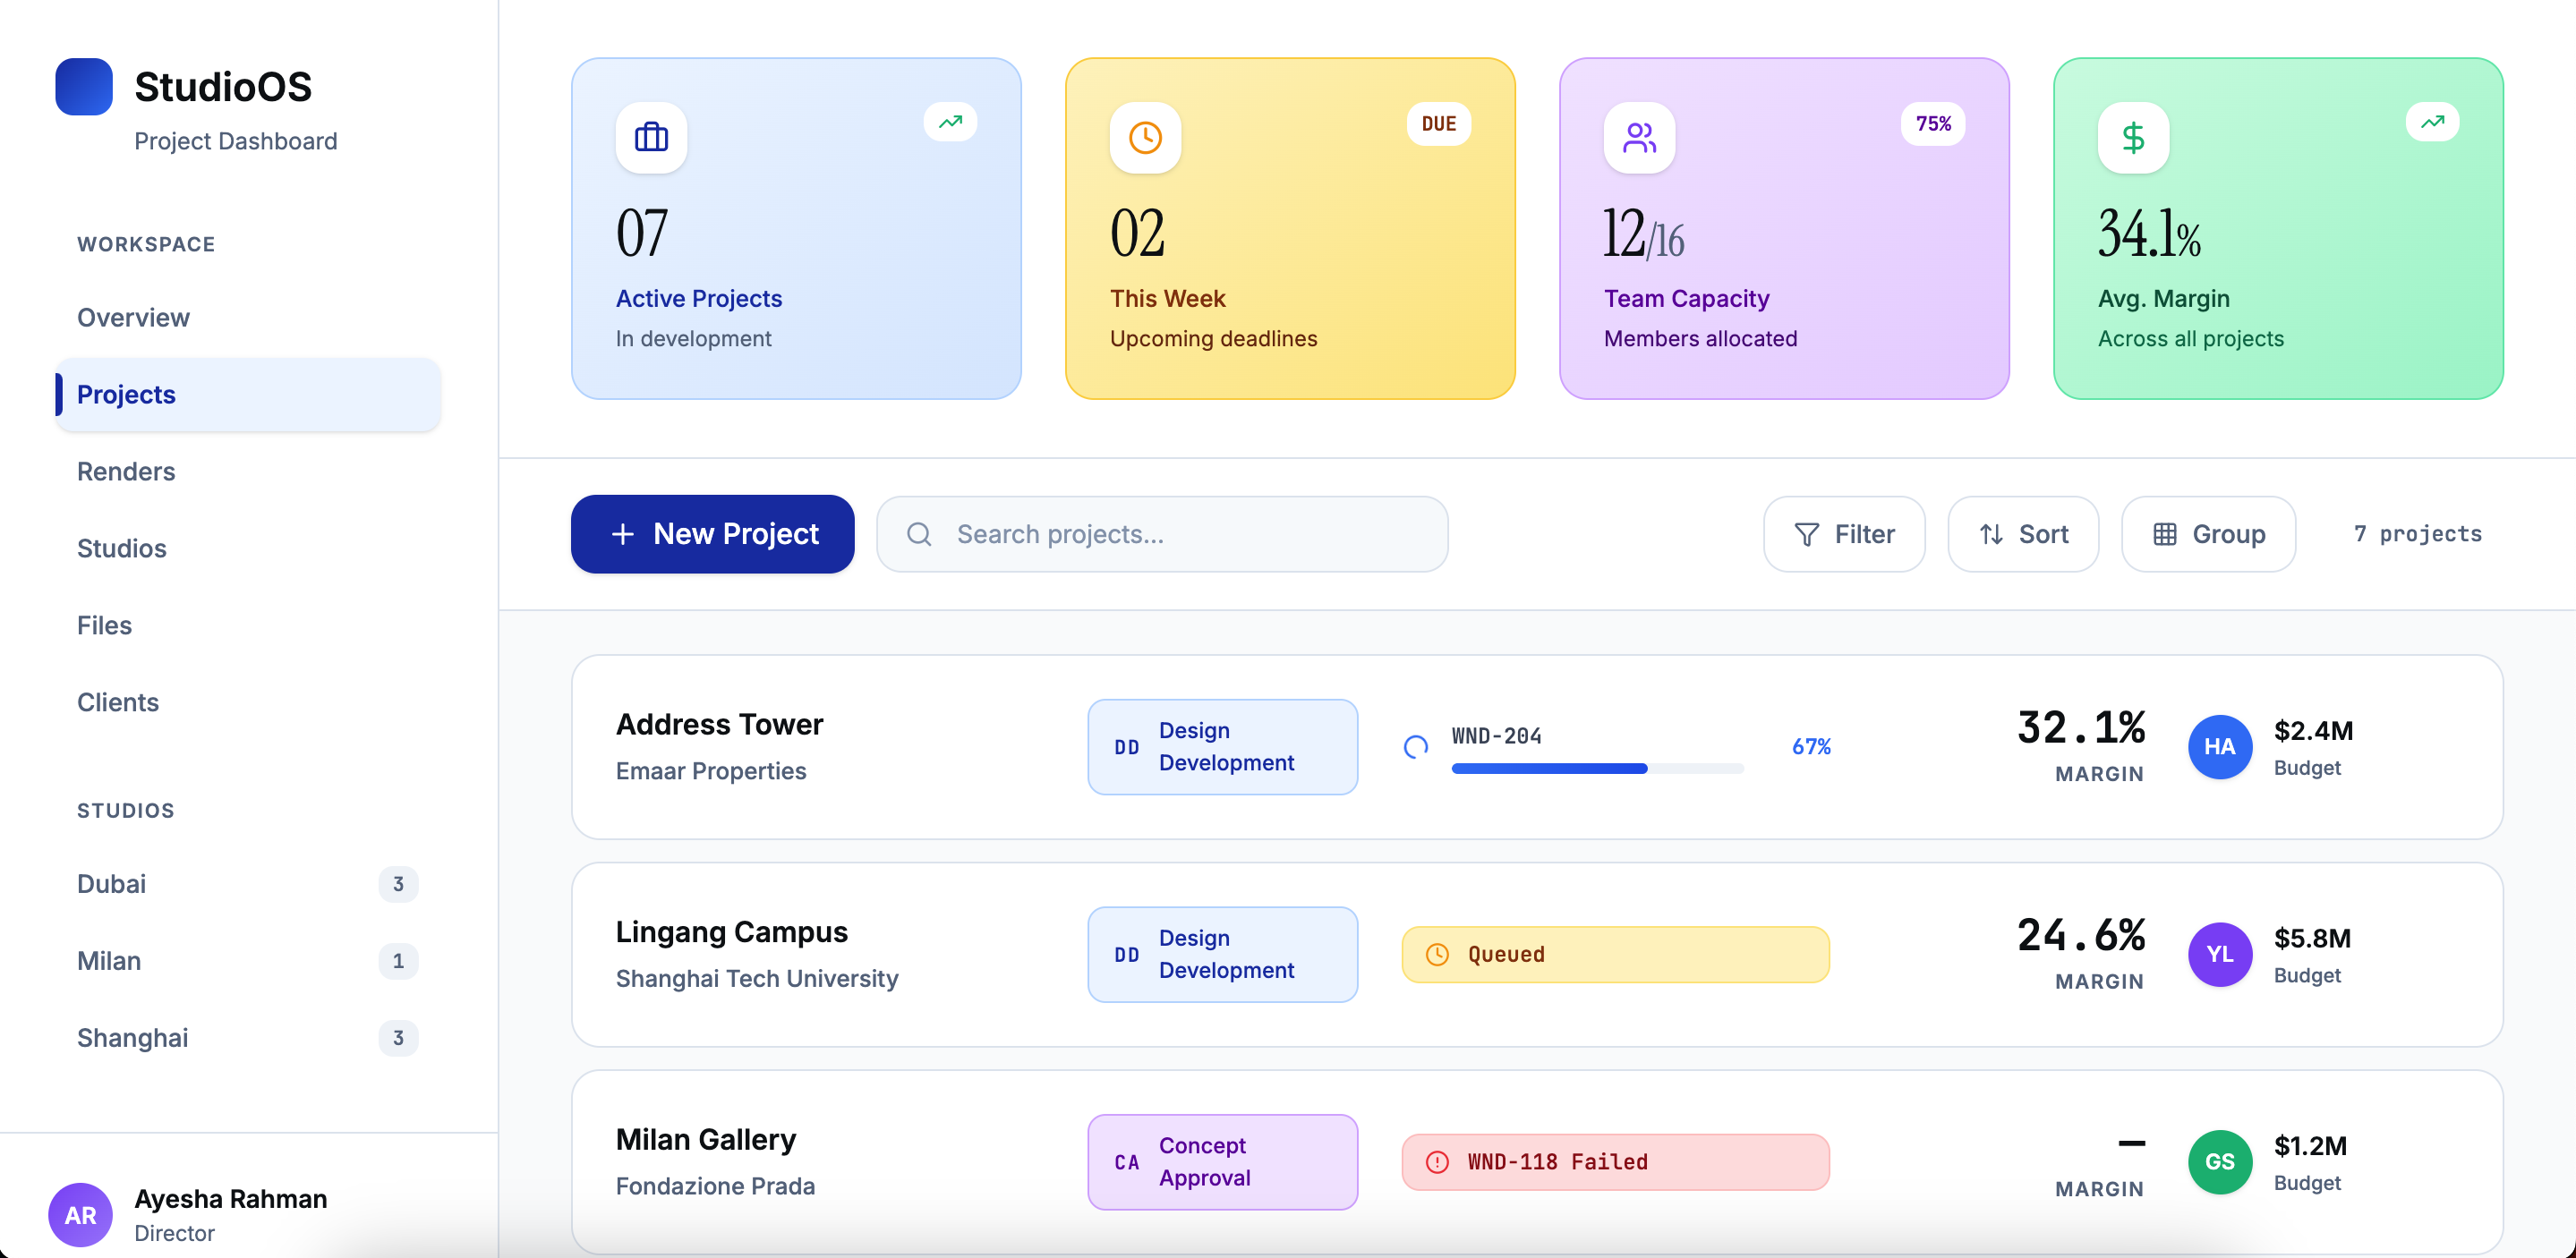
Refining UI density using an ultra-polished layout framework.
- Aesthetic Refinement: Uses a rich dark-charcoal background, sharp white text layouts, and terracotta accent highlights to mark urgent project risks.
- The Grid Choice: Replaced heavy block lines with subtle, low-contrast background rules, giving the data environment a clean, high-end design feel.
Hi-fi Screen — StudioOS WorkspaceFig. 13
Chapter 14
Design System
Standardizing component tokens ready for engineering handoff.
- The Token Core: Built on an 8-point spatial grid defining primitive and semantic style rules for spacing typography, margins, and component corners.
- The Asset Library: Documents 30+ responsive web assets, enabling seamless, scalable engineering execution for future product enhancements.
Design Tokens · StudioOSFig. 14
Surface · neutral
Canvas
#FFFFFF
surface.0
Subtle
#F9FAFB
surface.1
Panel
#F3F5F8
surface.2
Rule
#E5E7EB
divider
Ink
#0F172A
type.high
Mute
#6B7280
type.low
Accent · indigo primary & pastel taxonomy
Primary
#0C249C
action / link
Tag · Blue
#D8E4FC
category
Tag · Violet
#E4CCFC
category
Tag · Mint
#A8F0CC
active / ok
Tag · Amber
#FCE490
warn / pending
Tag · Coral
#FCD8D8
risk / removed
Type scale
display.xlInstrument Serif56 / 64Aa
display.mdInstrument Serif32 / 36Aa
body.mdInter15 / 24Ag
mono.smJetBrains Mono11 / 160Oo
eyebrowJetBrains Mono · UC11 / 16 · .16emEYEBROW
Components
Row · active
RND-204 · 67%
Tags
CDOKWARNRISK
Stat
$1.42M
+24% YoY